
Last updated: August 14, 2026
Silver’s 47% Fall Did Not Slow Copper Metallization
A solar panel is a sheet of glass over a few dozen slices of silicon, and printed across the face of each slice is a comb of hair-thin metal lines called the gridlines. Sunlight knocks electrons loose inside the silicon; the gridlines collect them and carry the current away. Printing those lines is the step the industry calls metallization, and it has used silver for it since the technology worked at all, for one reason: silver conducts electricity better than any other metal. The solar industry now wants to print the gridlines in copper instead, and has spent the last four years working out how.
The obvious explanation is price, and for eighteen months the price cooperated. Silver ran from an average of about $28 an ounce in 2024 to roughly $121.60 an ounce on 29 January 2026, an all-time high. Then it collapsed — more than 30% inside thirty hours — and kept sliding. Silver traded at $64.77 an ounce spot on 13 August 2026, 47% below the January peak, on Trading Economics’ quote.
Silver falling by half should have taken the urgency out of replacing it. Instead, not one manufacturer cancelled, paused or reversed a copper program through the crash, and the largest new copper capacity in the industry’s history came online after it. Price and scarcity are separate arguments and only one of them moved. What follows is what the other one says.
How Much Copper Is in a Solar Panel?
Copper already outweighs silver inside a solar panel by a factor of tens, and almost none of that copper has anything to do with the current argument. A finished panel — the industry calls it a module — is an assembly of individual silicon cells, usually about 72 square wafers cut in half to make 144 pieces, soldered into a chain by flat tinned copper strips called ribbons. More copper sits in the busbars — the wider strips the fine gridlines feed into — and in the leads inside the weatherproof junction box bolted to the module’s back. More again runs in the cable to the inverter, the unit that turns the panel’s direct current into the alternating current a house or a grid uses.
Structural copper of that kind comes to about 1% of a module’s weight — roughly 250 grams in a 25 kg module, and proportionally more in a 2026-generation panel, which weighs 30 kg and up. The figures come from a review of photovoltaic recycling compiling composition data from Choi and Fthenakis and from Weckend and colleagues. Silver comes to about 6 grams in a 600-watt module, at the 10 milligrams per watt that the industry’s technology roadmap, ITRPV, gives as 2025’s median for mainstream cells in its 17th edition. The two numbers describe modules a decade apart, so read the ratio as somewhere around 40 to 50 times more copper than silver rather than a precise multiple. Either way the argument is about the last 1% of the metal in a panel, not the first 99%.
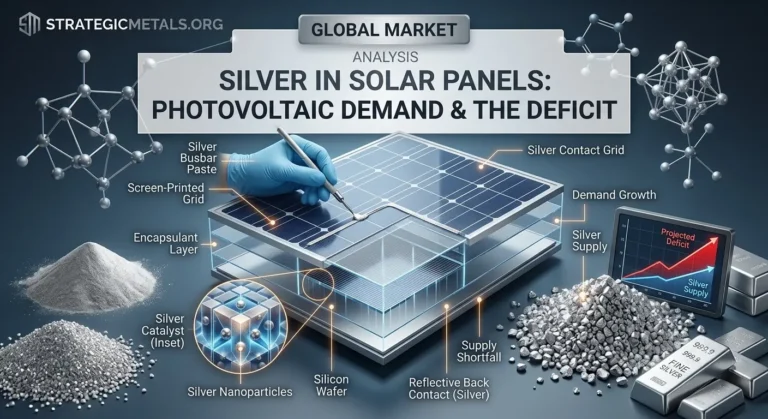
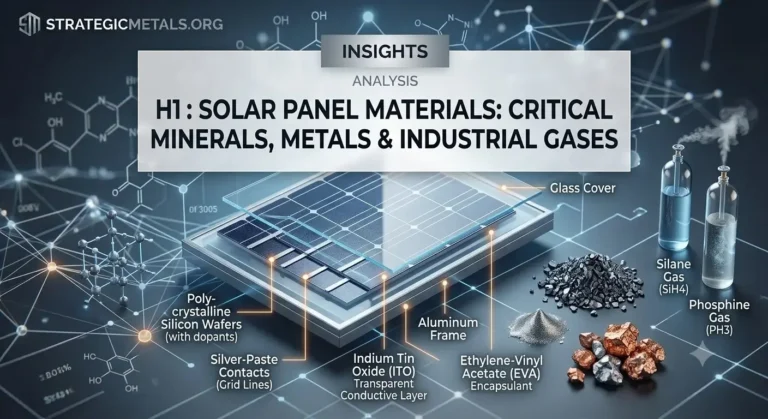
At the level of a whole power plant the copper multiplies again. A utility-scale solar farm uses about 2.5 tonnes of copper per megawatt once array wiring, inverters and transformers are counted, on the Copper Development Association’s commissioned survey of North American installations, which puts the range at two to three tonnes. Rooftop is copper-heavier per megawatt, not lighter: the same survey put residential and commercial systems higher still, because small installations get less benefit from short, fat cable runs. Published intensities elsewhere run to 5 tonnes a megawatt, and the spread comes from where each study draws the boundary — whether grid connection and site cabling count as part of the plant. A panel’s full bill of materials, from silicon to the industrial gases used to make it, is mapped in our overview of solar panel materials.
| Where the metal sits | Which metal | How much |
|---|---|---|
| Gridlines printed on each cell | Silver | ~10 mg per watt — about 6 g in a 600 W module |
| Ribbons, busbars, junction box, cable | Copper | ~1% of module weight — ~250 g in a 25 kg module |
| Array wiring, inverters, transformers | Copper | ~2.5 t per MW utility; 3.8 t residential |
| Gridlines, if copper replaces silver | Copper | 1–2 mg per watt — 0.04–0.08% of the plant’s copper |
Copper vs Silver — 93% of the Conductivity
Silver holds the gridlines because every alternative is a downgrade on something a panel cannot afford to lose. Conductivity is measured against annealed copper, which is defined as 100% on the International Annealed Copper Standard — 58 megasiemens per metre. Silver runs at 105 to 108% on that scale, the highest of any metal; copper is the benchmark itself. So copper reaches roughly 93% of silver’s conductivity, and the gap is small enough that a well-made copper line can beat a silver one in practice, because commercial silver lines are not pure silver. They are printed as a paste — silver powder suspended in organic resin and glass frit, a powdered glass that melts during firing and welds the line to the cell. The paste is squeezed through a patterned mesh screen and baked, and the non-metal content dilutes the conductor.
Conductivity is the easy requirement. The hard one is that these lines must sit on a hot roof for a quarter of a century without changing. Silver does not corrode, and it does not move — it sits inert on the silicon surface for decades, which is why 25-year and 30-year power warranties are writable at all. Copper does both. It oxidizes in air, and it diffuses into silicon, where individual copper atoms create sites that let charge carriers recombine and quietly bleed away the cell’s output. Every copper metallization scheme in existence is an engineering effort to get copper’s price and conductivity while blocking its chemistry, and every scheme below is a version of that trade.
| Property | Silver | Copper |
|---|---|---|
| Conductivity (IACS) | 105–108% — highest of any metal | 100% by definition (58 MS/m) |
| Price | $2,082/kg — $64.77/oz spot, 13 Aug 2026 | $14.38/kg — $14,376/t London Metal Exchange cash, 12 Aug 2026 |
| World reserves (USGS, Feb 2026) | 610,000 t | 980,000,000 t — about 1,600× |
| Mined in 2025 (USGS estimate) | 26,000 t | 23,000,000 t — about 885× |
| Behaviour over 25 years | Inert; does not corrode or migrate | Oxidizes in air; diffuses into silicon |
| Field record on cells | Seven decades | Four years at commercial volume |
Lead Times — Why Copper Lines Predate the Spike
The silver price gave the industry a genuine shock and then took most of it back, and the copper programmes ignored both halves. Silver averaged about $28 an ounce through 2024, reached $49 in October 2025 as pv magazine USA reported the industry starting to worry, hit a record $83.62 on 28 December 2025, and then ran to roughly $121.60 five weeks later. By 26 June 2026 it was back near $57. The metal lost more than half its value in five months and no manufacturer changed course.
| Date | Silver | What the industry did |
|---|---|---|
| Through 2024 | ~$28/oz average | AIKO, a Chinese cell maker, already mass-producing silver-free copper cells at Zhuhai since 2022 |
| 9 Oct 2025 | ~$49/oz | Thrifting accelerates; substitution still marginal |
| 28 Dec 2025 | $83.62/oz — then a record | LONGi, the world’s largest solar manufacturer, announces base-metal mass production for Q2 2026 |
| 29 Jan 2026 | ~$121.60/oz — all-time high | Falls 30%+ within 30 hours |
| 22 Apr 2026 | ~$75–80/oz | AIKO commits RMB 1.665bn (about US$243m at April rates) to convert 11 GW to back-contact |
| 26 Jun 2026 | ~$57/oz — 2026 low | No programme cancelled or paused |
| 9 Jul 2026 | ~$58/oz | LONGi switches on 21 GW back-contact line at Xixian |
| 13 Aug 2026 | $64.77/oz spot | 47% below the January peak |
LONGi’s founder and chief technology officer explained why the price barely mattered. “What is commercially available today passed mass production verification two to three years ago,” Li Zhenguo told PV Tech in its account of the company’s metallization rollout. The 21 GW line that started up in July 2026 was locked in around 2023, two years before silver’s run began. AIKO’s copper interconnect went into mass production at Zhuhai in 2022, earlier still. Neither was a response to the spike, because neither could have been. A cell line takes years to specify, buy, install and qualify, and the metal price on the day it switches on is not the price anyone planned against.
Silver Is 1% of an Installed Rooftop System
Silver’s share of a solar cell’s cost and silver’s share of a solar customer’s bill are different numbers by a factor of about twenty-five. On the cell, the metal is significant. On the invoice, it is close to invisible. The US National Renewable Energy Laboratory’s benchmark, Documenting 15 Years of Reductions in U.S. Solar Photovoltaic System Costs, priced a first-quarter-2024 residential system at $3.25 per watt installed, of which the module itself was $0.40 — 12.3%. A utility-scale plant came to $1.15 a watt with the module at $0.35, or 30.4%.
Put the silver price against that. At the ITRPV median loading of 10 milligrams a watt, the silver metal in a cell was worth 2.08 cents a watt on 13 August 2026 and 3.91 cents at the January peak. Measured against NREL’s residential benchmark, silver at its all-time high was 1.2% of what an American homeowner paid for a rooftop system, and today it is 0.64%. Utility-scale runs higher because the module is a bigger share of a cheaper plant — 3.4% at the peak, 1.8% today. The arithmetic mixes a 2025 loading and a 2026 price with a 2024 cost benchmark, which is the newest NREL has published, so treat the percentages as approximate. They would have to be wrong by an order of magnitude to change the conclusion.
Silver’s share of cell cost is itself disputed, and the disagreement is mostly about what is being divided by what. Analysts quote cell cost or module cost, silver paste or silver metal, and figures struck at $30 silver alongside figures struck at $121. The bases in the middle column below are what separate the six numbers.
| Silver’s share of cost | Of what, exactly | Who, and when |
|---|---|---|
| More than 30% | Total cell cost; over 50% of non-silicon cost | Shanghai Metal Market, 8 Dec 2025 |
| Up to 30% | Total cell cost; silver 16–17% of module cost | Hanwei Wu, OPIS, Jan 2026 |
| 9.9% → 22.1% | Front and rear busbar paste, Jan 2025 to 2026 | Shanghai Metal Market, 12 Jan 2026 |
| ~8% → over 20% | Cell cost, across the price rise | Metals Focus, Jun 2026 |
| 10–20% | Total solar cell cost | World Silver Survey 2026, Apr 2026 |
| ~12% | Total module cost; over 50% of non-silicon cell cost | 36Kr, 3 Dec 2025 |
Copper Plating Saves About 20% of Silver’s Cost
Copper settled at $14,376 a tonne, London Metal Exchange cash, on 12 August 2026 — $14.38 a kilogram against silver’s $2,082, a ratio of about 145 to one. What a manufacturer nets after paying for the plant that uses copper instead is a different figure, and no clean, current, all-in comparison of screen-printed silver against plated copper on a cents-per-watt basis has been published. Two academic papers addressing it directly sit behind publisher blocks. Fraunhofer ISE’s own 2024 conference paper on copper as a cost-effective alternative to silver contains metal prices and loadings and no cost-of-ownership figures at all.
Two real net numbers do exist, and both are small. Copper electroplating at AIKO reduces cost by RMB 0.03 per watt, on Shanghai Metal Market’s January 2026 survey of silver-free cell programmes. A low-silver composite route saves one to two Chinese cents, RMB 0.01 to 0.02 a watt, on TOPCon cells — the design that is now most of the market. Converted at 6.745 yuan to the dollar, AIKO’s saving comes to about 0.44 US cents a watt. The silver it displaces is worth 2.08 to 2.54 cents, depending on whether the cell is a mainstream TOPCon at 10 milligrams a watt or a back-contact cell at 12.2. Either way, somewhere between a sixth and a fifth of the silver’s value survives as a saving.
The rest goes on the plant. Plating equipment costs up to three times as much as conventional printing, on the same survey, and the process adds nickel, the protective cap, the wet chemistry and whatever yield is lost while a new line is learned. None of those costs falls when the silver price falls, which is why the case for copper weakens faster than the metal price does and strengthens more slowly than it recovers.
An older analysis reached the same shape from first principles. Redlinger, Woodhouse and Eggert costed electroplating at a 0.5 to 1.5 cent per watt materials saving, offset by about 1.0 cent of extra capital and maintenance cost and a further 0.4 to 0.8 cents of electricity. Netted out, that is plausibly zero or negative. Their analysis appeared in Photovoltaics International as a study of the silver cost component in crystalline silicon module manufacturing. The paper carries no publication date and internal evidence puts it in the mid-2010s, when silver was near $16 to $20 an ounce, so the materials term has grown severalfold since while the capital term has not. That is exactly why the calculation now tips positive, and exactly why it tips back when silver falls.
Silver Reserves, Not Price, Force Copper Metallization
A falling silver price does nothing about the quantity of silver in the ground. World silver reserves stand at 610,000 tonnes against 980 million tonnes of copper, on the United States Geological Survey’s Mineral Commodity Summaries of February 2026 and its copper summary in the same edition. Copper reserves are about 1,600 times larger. Annual production tells the same story: 26,000 tonnes of silver mined in 2025 against 23 million tonnes of copper, a ratio of roughly 885 to one.
Those ratios only matter against a build target. A net-zero energy system needs 63.4 terawatts of cumulative solar capacity by 2050, on the industry’s own roadmap — the International Technology Roadmap for Photovoltaics, 17th edition, published in June 2026 by the VDMA equipment group from data supplied by 38 organisations. The world had about 2.97 terawatts installed at the end of 2025, on the Fraunhofer ISE Photovoltaics Report of 14 July 2026. So roughly 60 terawatts remain to be built, and what that costs in silver depends entirely on how much silver each watt uses.
| If ~60 TW gets built at… | Silver required | Share of the 610,000 t reserve |
|---|---|---|
| 10 mg/W — 2025 TOPCon median | ~600,000 t | ~99% |
| 6.3 mg/W — ITRPV’s 2036 TOPCon target | ~380,000 t | ~62% |
| 5 mg/W — analysts’ 2027 target | ~300,000 t | ~50% |
| 3.9 mg/W — Risen’s heterojunction line today | ~235,000 t | ~39% |
| 2 mg/W — the terawatt threshold | ~120,000 t | ~20% |
| 1.1 mg/W — Fraunhofer’s laboratory cell | ~66,000 t | ~11% |
Two inputs to that table are measured and two are assumed. The loadings come from ITRPV and from company statements; the reserve figure comes from the USGS. The 63.4 terawatt target is ITRPV’s own net-zero scenario rather than a forecast, and reserves are not a fixed stock — they are what is economically extractable at current prices, and they have grown historically as prices rose and exploration followed. Change either assumption by half and the top row still says solar alone would need most of the world’s known silver. At today’s loadings the build would exhaust every tonne currently on the books, and every row below the first is a description of how the industry escapes that.
Published work reaches the same place by a different route. Cumulative photovoltaic silver demand to 2050 comes to 450,000 to 520,000 tonnes — 85 to 98% of the reserves booked at the time, on work by Hallam and colleagues at the University of New South Wales published in Progress in Photovoltaics in 2023. Their scenario assumed the older p-type silicon technology stayed dominant and installed capacity reached 15 to 60 terawatts. Reserves have since been revised up, which puts the same cumulative demand at 74 to 85% of the 610,000 tonnes the USGS now books.
Li Wang, of the same UNSW metallization group, stated the operational conclusion in a March 2025 note from the Australian Centre for Advanced Photovoltaics. “If photovoltaics is to scale sustainably to the terawatt level, we must reduce silver consumption to less than 2 milligrams per watt.” Against the 10 milligrams a mainstream cell used in 2025, that is a fivefold cut. The size of the resource sets that target, not the price of it.
Thrifting — Cutting Silver Without Changing Metal
Replacing silver with copper is the second way to use less silver, and so far it is losing badly to the first. Thrifting — the industry’s word for redesigning a cell to need less metal — has done nearly all the work to date. Printing the fingers narrower and taller so they carry the same current with less cross-section, replacing wide busbars with dozens of thin wires, and then removing busbars entirely have between them cut the silver per watt by roughly tenfold, without changing the metal at all.
Four cell designs carry that history and the article’s numbers, so they are worth naming once. PERC is the older workhorse now being retired, and TOPCon replaced it as most of what the world builds today. Heterojunction, often written HJT, is a higher-efficiency design that runs at low temperature and uses the most silver. Back-contact cells move all the metal to the rear so the front catches more light. The historical series is patchy because the industry changed its unit partway through, from milligrams per cell to milligrams per watt as cells got more powerful. Screen-printing engineers at PICON Solar recorded about 300 milligrams of silver paste per wafer in 2010; ITRPV’s eighth edition, published in September 2017, gave 100 milligrams per cell as the 2016 median and 90 for 2017. By 2025 a TOPCon cell carried about 86 milligrams and a heterojunction cell 75, on figures from OPIS, while cells had roughly doubled in output. Per watt, the roadmap’s 2025 medians span 8.9 to 12.2 milligrams across the four mainstream cell designs, set out in the table below.
| Silver per cell or per watt | Figure | Source |
|---|---|---|
| 2010 — silver paste per wafer | ~300 mg (paste, not metal) | PICON Solar |
| 2016 / 2017 — silver metal per cell | 100 mg / 90 mg | ITRPV 8th edition, Sep 2017 |
| 2025 — silver metal per cell | TOPCon 86 mg · heterojunction 75 mg · back-contact 135 mg | OPIS, Jan 2026 |
| 2025 — per watt, median | PERC 8.9 · TOPCon 10 · heterojunction 12.0 · back-contact 12.2 | ITRPV 17th edition, Jun 2026 |
| 2025 — per watt, alternative | PERC 6.85 · TOPCon ~9 · heterojunction ~6.39 | Shanghai Metal Market, Dec 2025 |
| 2026 — Risen heterojunction line | 3.9 mg/W, down from 10 | Risen Energy, Jun 2026 |
| 2026 — Fraunhofer ISE laboratory | 1.1 mg/W TOPCon · 1.4 mg/W heterojunction | Fraunhofer ISE, Apr 2025 and Apr 2026 |
| 2036 — ITRPV roadmap target | TOPCon 6.3 · heterojunction 4.3 mg/W | ITRPV 17th edition |
The two sources in that table disagree sharply about heterojunction. ITRPV puts heterojunction at 12.0 milligrams a watt, the highest of the mainstream architectures, because its low-temperature pastes conduct worse and need more metal. Shanghai Metal Market puts it at 6.39, below TOPCon. Neither source states whether the cells it surveyed were running pure silver paste or silver-coated copper, and that difference alone would account for the gap — a coated-copper cell reports a low silver figure without registering as a substitution anywhere. Where the analysts and the equipment roadmap disagree again is on pace: metals analysts expect the industry below 5 milligrams a watt by 2027, while ITRPV’s own ten-year roadmap does not reach 6.3 on TOPCon until 2036.
No published source separates the historical reduction into geometry versus substitution, so how much of the tenfold cut copper can claim is unknown. The closest available figures are forward-looking: Metals Focus reckons paste-application and cell-layout changes have cut silver by around 10% against earlier designs, with zero-busbar and ultra-fine printing worth another 10 to 20%. What is clear is the aggregate. Installed photovoltaic capacity rose more than tenfold over the past decade while photovoltaic silver demand grew only threefold — roughly a 70% cut in silver per watt, achieved almost entirely without copper. Oxford Economics recorded it for the Silver Institute in Silver, the Next Generation Metal, December 2025. The same pattern of using less rather than switching runs through the future uses of silver across every industry that buys it.
Can Copper Replace Silver in Solar Cells?
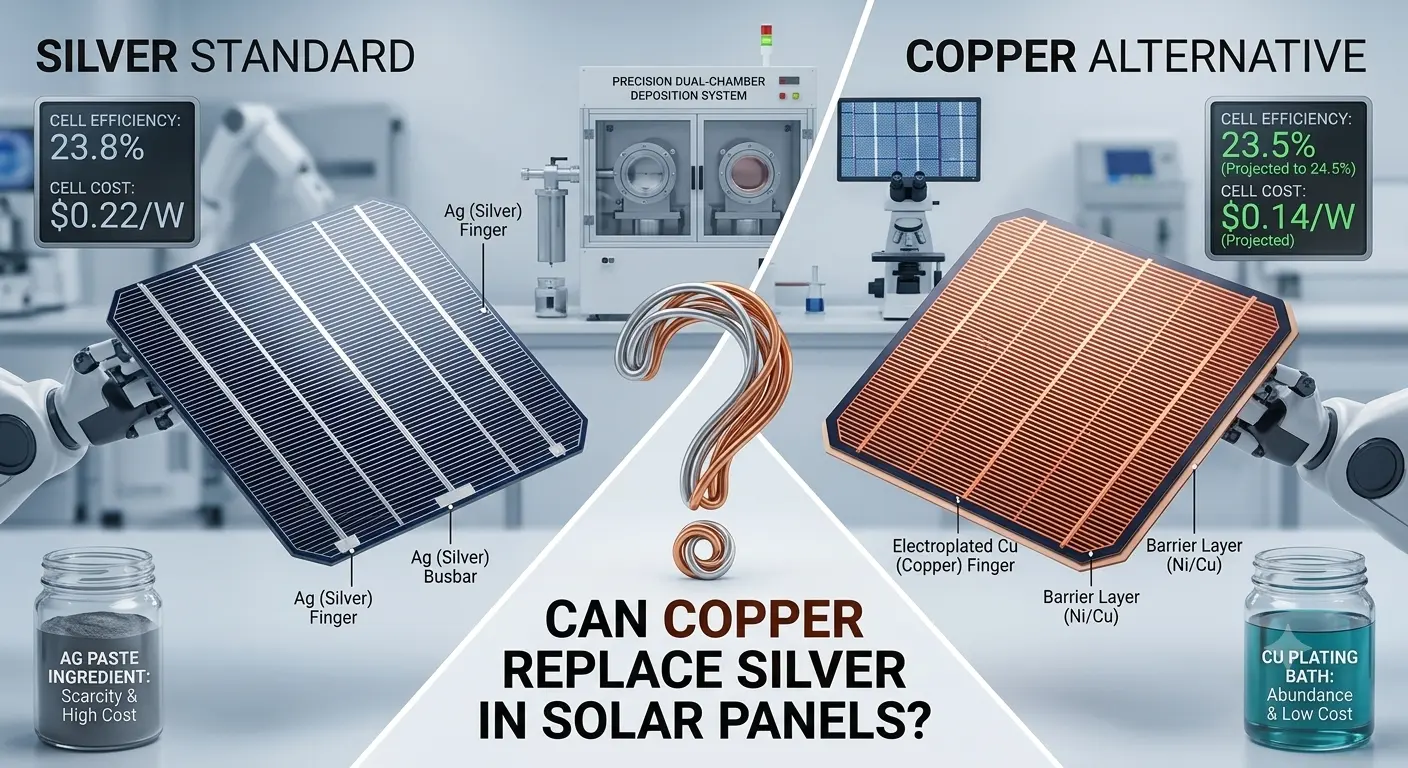
Copper reaches a solar cell by three routes. One grows pure copper out of a chemical bath; one prints a paste in which each copper particle wears a silver coat; the third prints a copper alloy engineered to resist oxidation on its own. They differ in how much silver they remove, how much new factory equipment they need, and how much of the reliability question they leave open. An announcement saying “copper” can mean any of the three.
| Route | What it is | What it costs and removes |
|---|---|---|
| Electroplating | Nickel barrier, then copper grown from a bath by electric current, then a thin silver or tin cap | Removes the most silver — down to ~1 mg/W in the lab. Needs a new wet-chemistry line at up to 3× the capital cost of printing |
| Silver-coated copper paste | Copper particles wrapped in a thin silver shell, printed on existing screen printers | Cuts silver 30–50%. No retooling — same lines, same steps, cheaper ink |
| Copper alloy paste | Nano-alloy with an anti-oxidation coating and a nanoscale barrier layer, printed conventionally | Silver reduction not disclosed. LONGi’s production route; no new plating line |
Electroplating — the Nickel/Copper/Silver Stack
Electroplating builds the contact as three metals stacked, each solving a problem the one below it creates. Nickel goes down first as a diffusion barrier, physically blocking copper atoms from reaching the silicon. Copper is grown on top of it out of a chemical bath by passing an electric current through the solution, which deposits pure metal rather than a diluted paste. A thin cap of silver or tin goes on last, because bare copper exposed to air oxidizes and the oxide raises resistance and weakens the solder joint.
Done well, the result beats silver paste on conductivity and on silver loading at once. Fraunhofer ISE reached 1.1 milligrams of silver per watt on M10-format TOPCon cells at 24% efficiency using ultraviolet-laser structuring and electrochemical nickel-copper-silver plating, against an industry standard of 10 to 12 milligrams — a tenfold cut, measured across a batch of 186 cells. Nickel-copper electroplating “could be firmly established in the photovoltaic market within two to three years,” said Sven Kluska, who leads the institute’s electrochemical processes group, in its April 2026 announcement. His colleague Florian Clement added a second motive that has nothing to do with cost. Plating “could also lead to significantly less dependence on China than is currently the case with silver pastes.”
The obstacle is patterning. Copper has to land only where the gridlines belong. Doing that selectively, cleanly and fast enough for a line producing a wafer every second has been the hard part for a decade. The semiconductor industry solved the same problem long ago, but its methods are orders of magnitude too slow and too expensive for solar. Plating also means wet chemistry, capital equipment and plating waste that a screen-printing shop does not own, handle or have permits for. That is the practical reason the cheaper route arrived first.
Silver-Coated Copper (Cu@Ag) and Alloy Pastes
The gentler route keeps the printing process and changes the ink. In a silver-coated copper paste, each particle is a copper core wrapped in a thin silver shell: the copper cuts the precious-metal content while the silver skin resists oxidation and lets the paste fire onto the cell like an ordinary silver paste. Metals Focus reports that silver-coated copper powder cuts silver use by 30 to 50% at similar cell performance, and it does it without a single new machine. Fraunhofer ISE’s 1.4 milligram-per-watt heterojunction cells of April 2025, made with Meyer Burger, combined silver-copper paste on the front with pure copper paste on the rear and still beat their all-silver reference on efficiency.
The alloy route is newer and less disclosed. LONGi’s Advanced Contact Matrix combines a nanoscale barrier layer, a copper-based alloy and a point-contact structure, printed rather than plated, with a nano-scale anti-oxidation coating standing in for the plated cap. LONGi has published no silver-reduction figure and no cost saving for it, on a technology now running at 21 GW. What it has published is performance: 27.6% cell efficiency certified by the Institute for Solar Energy Research in Hamelin, a 672-watt module in certification, and standard-size modules above 690 watts at 25.54%.
Copper Solar Panels Have No 25-Year Record
Solar modules are sold with 25- and 30-year power warranties, and no copper-metallized module has been on a roof for anything close to that. The oldest commercial silver-free copper cells went into production at AIKO’s Zhuhai plant in 2022, which makes the field record four years long against silver’s seventy. Everything known about copper’s behavior in year twenty is inferred from accelerated laboratory testing. Accelerated testing is exactly the tool that struggles with slow failures: a barrier defect that lets copper through in year twelve does not show up in a thousand hours at 85°C.
The installed base offers no help either, because it is almost all new. 65% of the world’s solar capacity at the end of 2022 had been built in the preceding five years, on the International Energy Agency’s Trends in PV Applications 2023, and three record years since have pushed that share higher. Almost nothing operating today has tested any metallization over a full warranty period, copper or silver — the difference is that silver’s behavior has been understood since Bell Labs, and copper’s has not.
Copper Oxidation & Diffusion into Silicon
Copper moved in both directions at once when plated cells were put through damp heat — a thousand hours at 85°C and 85% humidity, the standard accelerated ageing test. Karas and colleagues reported it in ACS Applied Materials & Interfaces in 2022, in a study of copper outdiffusion from plated solar cell contacts. It travelled upward, through capping layers made of both tin and silver. It also went down: the instrument they used to profile the layers detected “elevated levels of Cu at the Si surface and in the Si cell bulk.” The damage showed up in the electrical measurements. One sample’s pseudo fill factor fell from 82.1% to 77.0% — pseudo fill factor being a laboratory measure of how squarely a cell turns its voltage and current into power, taken so that wiring resistance does not confuse the reading. Their conclusion was that “there are unresolved questions on the long-term integrity of plated contact structures.”
Earlier accelerated tests, which the same paper reviews, found damaging diffusion through the nickel barrier only where that barrier was thinner than about 200 nanometres. Read straight, that makes barrier thickness a manufacturing-control problem rather than a physics dead end — a plating line that reliably lays down 250 nanometres of nickel is in different territory from one that sometimes lays down 150. Whether a factory holds that tolerance across billions of cells for twenty-five years is a separate question.
Bankability — Why Lenders Price the Data Gap
The reliability gap turns into money through what the industry calls bankability — whether a lender will finance a project built with a given product, and on what terms. Developers and financiers “want to know whether the products they invest in will perform reliably before they commit to procuring modules,” and the buying community “relies heavily on independent analysis and bankability reports.” The words are PVEL’s, an independent test laboratory that publishes annual module reliability scorecards, from its explainer for manufacturers. A metallization with four years of field data is harder to underwrite than one with seventy.
Buyers have converted that into a specific demand. Shanghai Metal Market’s January 2026 survey reported customers “generally demand experimental data demonstrating stable operation for at least five years before proceeding with installation” — a requirement no silver price can shorten. The strongest durability evidence copper currently has is a pass, not a record. Modules built from Fraunhofer’s 1.1 milligram cells cleared IEC 61215 — the international design-qualification standard, which runs modules through thermal cycling, damp heat, humidity-freeze, mechanical loading and ultraviolet exposure and caps how much power they may lose. A pass is a laboratory result, not a lifetime prediction.
Copper Takes HJT and Back-Contact, TOPCon Stays Silver
Where copper lands first follows from that. Heterojunction cells run at low temperatures that suit plating and use the most silver, so the payoff is largest. Back-contact cells put all their metallization on the rear in a pattern plating handles well. TOPCon, which is most of the market, is the hard case. Markus Fischer, vice president for R&D at Qcells, told PV Tech in June 2024 that “copper for TOPCon in mass production appears to be much more challenging” than on heterojunction. Molly Morgan, a senior research analyst at CRU Group, expects a split rather than a switch. “We believe we might see a coexistence of the two technologies in the 2028 to 2030 timeframe.”
The Companies Shipping Copper Cells Today
Copper metallization is in mass production today, at a handful of companies, and almost all of it is Chinese. The table gives each company’s route as well as its scale, because the announcements use “copper” for processes that share little beyond the element. Two are easy to conflate. LONGi’s 21 GW line is an alloy paste, not plating, and AIKO’s 11 GW capacity conversion announced in April 2026 changes the cell architecture from PERC and TOPCon to back-contact, with no copper metallization specified in it.
| Company | Route | Where it stands, August 2026 |
|---|---|---|
| AIKO (China) | Silver-free copper interconnect on back-contact cells | Mass production at Zhuhai since 2022; more than 12 GW of copper-based modules shipped in total — under 2% of one year’s global module output; 14.71 GW of back-contact modules shipped in 2025 |
| LONGi (China) | Advanced Contact Matrix — copper alloy paste, not plating | 21 GW back-contact line live at Xixian since 9 July 2026; 27.6% cell efficiency certified; no silver-reduction figure published |
| Risen Energy (China) | Silver-coated copper paste on heterojunction | Production loading down from 10 to 3.9 mg/W; module power up from 700 to 740 W; module cost about RMB 0.02/W above mainstream TOPCon |
| SunDrive (Australia) | Direct copper plating on heterojunction | 26.41% on an M6 cell (274.3 cm²), certified by ISFH in September 2022; no newer certified result published; scaling with Chinese partners |
| Maxwell (China) | Heterojunction and plating equipment | Leading heterojunction equipment maker; SunDrive’s scale-up partner |
| Fraunhofer ISE (Germany) | Electroplated nickel-copper-silver; research | 1.1 mg/W TOPCon at 24% efficiency (April 2026) and 1.4 mg/W heterojunction (April 2025), against a 10–12 mg/W industry standard |
Copper “offers a compelling combination of conductivity, availability, and mechanical strength,” AIKO’s chief scientist Yongqian Wang told PV Tech’s August 2025 survey of the field. In the medium to long term, he predicted, “copper processes will inevitably become the standard for BC solar cells and module products.” AIKO sells the panels that prediction is about. Its durability figures are company data rather than independent testing: it reports its copper modules retaining 90.6% of output at year 25, against 87 to 88% for silver-paste panels, on a product with four years in the field.
Photovoltaic Silver Demand Fell 6% in 2025
Photovoltaic silver demand is already falling, and it is falling through a period of record installations. Photovoltaic demand ran to 186.6 million ounces in 2025, down 6% from 197.5 million in 2024, with a further 19% fall to about 151 million ounces forecast for 2026. Metals Focus published the figures for the Silver Institute in the World Silver Survey 2026 of 15 April. Its stated cause was not the copper switch specifically: “intense competition and increasing silver raw material costs led manufacturers to accelerate silver-thrifting and substitution.” Solar took about 22% of the 846.6 million ounces mined in 2025, a share that is shrinking rather than growing.
Demand is falling while the world builds more solar than ever — 706 GW of modules shipped in 2025, on ITRPV’s figures, containing about 7,244 tonnes of silver — 233 million ounces, or roughly 21.4% of total world supply including recycled metal.
Those two houses do not agree, and the gap is worth having rather than smoothing over. Metals Focus counts 186.6 million ounces of photovoltaic demand in 2025; ITRPV computes 233 million ounces of silver contained in the modules shipped that year. The two differ by about a quarter on the same year’s solar silver, because one measures metal bought by manufacturers and the other metal leaving the factory in finished panels, and inventory, scrap and paste recovery sit in between. Anyone quoting a single number for solar’s silver appetite is picking one of these without saying so. Silver’s own market stays in deficit either way: the World Silver Survey put 2025 at a 40.3 million ounce shortfall, the fifth consecutive one, and forecast 46.3 million for 2026, down from the 67 million Metals Focus had projected for the Silver Institute in February. The supply side of that equation, and why silver output does not rise when the price does, is the subject of our piece on silver in solar panels.
Copper Demand — the Gridline Switch Adds 0.08%
For the copper market, replacing every gram of silver in every solar cell on Earth is a rounding error. The gridline switch adds one to two milligrams of copper per watt. Across the 706 GW shipped in 2025, that is roughly 700 to 1,400 tonnes of copper against the 1.77 million tonnes those same modules consume in system wiring and equipment — between four and eight hundredths of one percent. The silver market moves. The copper market does not.
Solar’s real pull on copper is the wiring, and it is substantial. The International Energy Agency put solar-sector copper demand, in its Critical Minerals Market Review 2023 as reported by PV Tech, at 756,800 tonnes in 2022, peaking near 2.06 million tonnes in 2035 and then easing to 1.88 million by 2050 as the buildout matures. The IEA runs those projections under both its Announced Pledges and Net Zero scenarios and the published solar series carries no scenario label, so the trajectory is directional rather than a single forecast. Copper set its own record in the same month, at $14,455 a tonne on the London Metal Exchange cash settlement of 6 August 2026. What drove it was the grid and the data centre, covered in our guide to the future uses of copper and in metals in AI servers, which competes with solar for both metals at once.
A Short History of Solar Cell Metallization
The metal grid on a solar cell is older than the industry that argues about it, and for most of that history nobody costed it, because it cost almost nothing.
Bell Telephone Laboratories announced the first practical silicon solar cell on 25 April 1954 in Murray Hill, New Jersey. Daryl Chapin, Calvin Fuller and Gerald Pearson had built a device that turned about 6% of the sunlight falling on it into electricity — enough, in the demonstration, to run a small radio transmitter. It needed metal contacts to get the current out, and metal contacts it has needed ever since.
Screen printing became the industry’s default method for making them, and silver paste the default material, through the decades when solar was a niche. In 2010 a wafer took around 300 milligrams of silver paste, and at the silver prices of the day nobody minded. What changed was volume: as annual production went from gigawatts to hundreds of gigawatts, a metal the world mines 26,000 tonnes of a year became a constraint on how large the industry could get.
The response was thrifting first and substitution second. Fingers got narrower, busbars multiplied and then disappeared, and the silver in a cell fell by roughly an order of magnitude without the metal changing at all. Copper arrived properly in 2022, when AIKO began mass-producing silver-free copper contacts at Zhuhai — three years before the price spike, and on a decision taken earlier still.
Investing — No Pure Play in Copper Metallization
Nothing listed anywhere offers exposure to copper metallization specifically, and saying so plainly is more useful than implying otherwise. The switch is a line item inside companies whose share prices move on something else entirely. AIKO, LONGi and Risen are Chinese-listed module manufacturers whose results turn on module oversupply, polysilicon costs and export policy far more than on which metal sits in their contacts. SunDrive is private. Maxwell sells equipment rather than panels. Fraunhofer ISE is a research institute and not a company at all.
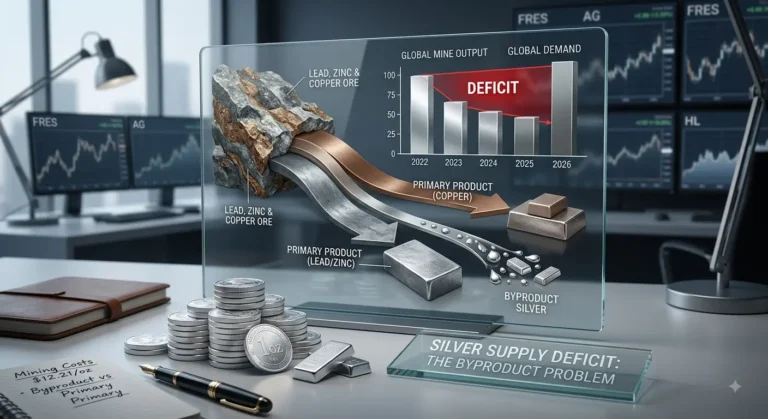
The metals themselves are no cleaner a proxy. Most of the world’s silver is dug as a by-product of copper, lead, zinc and gold mining, not by mines that set out to find silver. A change in solar’s silver appetite therefore does not translate into a change in any particular producer’s output. Where silver comes from, and why supply does not rise when the price does, is covered in our map of where silver goes.
What can be watched instead is the mechanism. Three things move before anything else does. The first is the share of new cells using copper, which is under 2% of annual output today and which ITRPV reports once a year. The second is the field record of the first plated and alloy modules as they age past their fifth year, since one high-profile failure would stall the transition. The third is the silver-to-copper price ratio, which sets what the saving is worth and stood near 145 to one in August 2026. Silver and copper themselves trade through physically-backed funds, futures and mining equities, described here as factual landscape and nothing more.
None of the above is a recommendation. Do your own research and speak with a licensed financial, tax or legal professional before making any decision.