
Last updated: August 20, 2026
Most Silver Is Never Mined on Purpose
The silver price rose 42% in 2025 on the annual average, the largest yearly gain in decades. The world’s mines responded by producing 3% more silver. For 2026 they are forecast to produce slightly less.
The price went further and came back, and the answer did not change. Silver reached an all-time high of $121.64 an ounce in January 2026 and has since fallen back to about $67, on Trading Economics’ quote for 20 August 2026 — spot, meaning the price for metal delivered now, rather than a futures contract. Mine supply, which is only counted annually, moved 3% one way in 2025 and is forecast 0.3% the other in 2026.
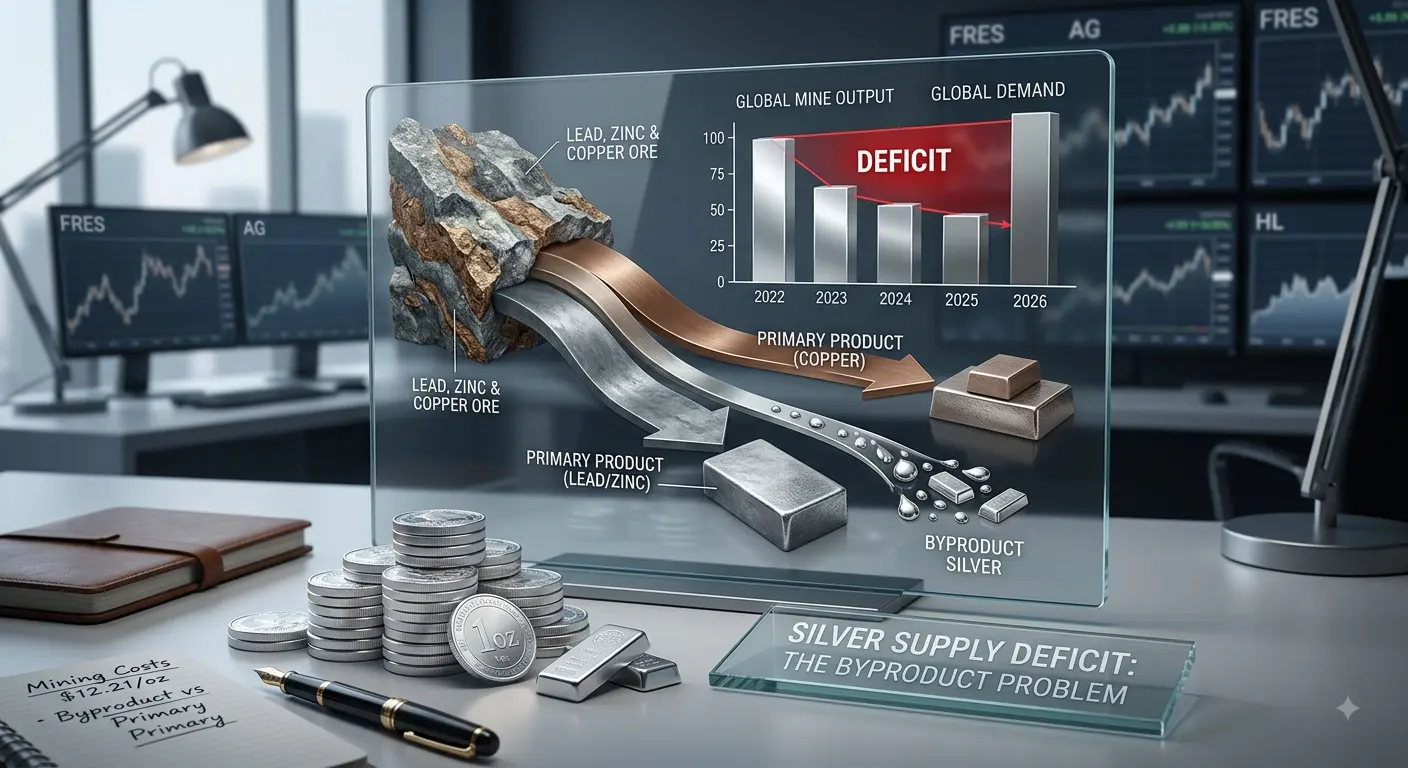
The explanation is not that miners were slow. Most of the world’s silver is not produced by anyone who is trying to. Silver is a byproduct — a metal that comes up alongside the one a mine was actually built to extract, the way cream comes with milk. A lead-zinc mine in Australia, a copper mine in Peru and a gold mine in Mexico all pull silver out of the ground as a side effect of their real business, and none of them chose their ore body, bought their equipment or wrote their mine plan with silver in mind.
Very little substitutes for the metal. Silver conducts electricity better than any other element — about 63 million siemens per metre against copper’s 59 — and unlike copper’s, its oxide still conducts, so an oxidised silver contact goes on working where an oxidised copper one stops. That puts it in the paste screen-printed onto solar cells, in the switches and relays inside cars and appliances, in brazing alloys, in electronics and in medical antimicrobials. Industry took 657.4 million ounces in 2025, 58% of total demand of 1,130.6 million ounces, on the World Silver Survey’s count; jewellery, silverware and investment took the rest.
The byproduct share reached 73.9% of all the silver mined on Earth in 2025. Only 26.1% came from mines where silver is the main event, and that share is the lowest ever recorded. A silver price therefore reaches about a quarter of world supply; the other three-quarters takes its instructions from copper, zinc and gold. That is why the market can run five straight years of deficit — years when demand outran supply and the difference came out of metal already above ground — without the mines answering, why the cheapest silver in the industry is dug by companies that are not silver miners, and why the number most often quoted for the shortfall has three different values in circulation.
Three-Quarters of Mined Silver Is a Byproduct
Lead and zinc mines produced more of the world’s silver in 2025 than silver mines did. Of 846.6 million ounces mined, they accounted for the largest single share, copper mines came second, and mines dedicated to silver came third — a ranking the Silver Institute and Metals Focus compile by asking what each mine was built for. The World Silver Survey 2026 records that the primary share “fell to a new low of 26%, highlighting increasing dependency on supply from by-product sources.”
| Where the silver came from (2025) | Million ounces | Share of world mine supply |
|---|---|---|
| Lead & zinc mines | 249.1 | 29.4% |
| Copper mines | 237.3 | 28.0% |
| Primary silver mines | 221.1 | 26.1% |
| Gold mines | 134.7 | 15.9% |
| Other | 4.5 | 0.6% |
| World total | 846.6 | 100% |
The United States Geological Survey reaches the same conclusion from entirely separate data. Its 2026 Mineral Commodity Summaries states that “silver was primarily obtained as a byproduct from lead-zinc, copper, and gold mines, in descending order of silver production” — the same ranking, arrived at independently. The USGS also counts the American operations directly: US silver came from 4 silver mines and 31 base- and precious-metal operations that produce it as a by-product or co-product.
Silver Hides Inside Lead, Zinc and Copper Ore
Geology decides the byproduct share, not corporate strategy. Silver rarely forms deposits of its own; it substitutes into the crystal structure of other minerals, sitting inside galena — lead bonded to sulphur, the mineral lead mines are built on — and inside the copper sulphides that copper mines chase. The USGS puts it in reserve terms: polymetallic ore deposits — rock carrying several metals worth recovering at once — account for more than two-thirds of US and world silver resources. Silver in those rocks is not a separate seam a miner could choose to follow. It comes up in the same shovel as the lead, gets separated in the same mill, and turns up as a credit on the same invoice.
A higher silver price cannot reverse that share. A zinc miner who wanted to double his silver output would have to find a different ore body, which is to say become a different company. The only operators who can respond to a silver price are the ones already sitting on rock where silver is the reason to dig — and by 2025 those operators accounted for barely a quarter of world supply.
Six of the Top Ten Silver Producers Dig Other Metals
The company table makes the same point in corporate form. The World Silver Survey 2026 ranks the world’s largest silver producers in millions of ounces, or Moz. Read down the second column: KGHM, Southern Copper and Codelco are copper companies, Newmont is a gold company, Hindustan Zinc is a zinc company, and Glencore is a diversified miner and trader. Six of the top ten dig for something else.
| Producer | What it is really mining | 2025 silver output |
|---|---|---|
| Fresnillo (Mexico) | Silver and gold | 47.6 Moz |
| KGHM Polska Miedź (Poland) | Copper | 43.3 Moz |
| Polymetal JSC (Russia) | Gold and silver | 28.0 Moz |
| Newmont (Mexico) | Gold, zinc and lead | 28.0 Moz |
| Southern Copper (Peru, Mexico) | Copper | 24.2 Moz |
| Pan American Silver (Americas) | Silver and gold | 22.8 Moz |
| Glencore (global) | Copper and zinc | 20.4 Moz |
| Hindustan Zinc (India) | Zinc and lead | 20.2 Moz |
| Codelco (Chile) | Copper | 18.0 Moz (estimated) |
| Coeur Mining (Americas) | Gold and silver | 17.9 Moz |
The label breaks down even at the top of the table. Fresnillo is the largest silver producer on Earth, and its own 2025 preliminary results show silver at 46.5% of adjusted revenue against gold at 44.6% — a coin-flip away from being a gold company. Coeur Mining, tenth on the list and named after a silver district, drew 65% of its 2025 revenue from gold. Codelco does not publish a silver production figure at all; the 18.0 Moz above is a Metals Focus estimate, because silver appears in Codelco’s accounts only inside an “other products” line shared with sulphuric acid.
Silver Cut KGHM’s Copper Cash Cost by 39%
A record silver price took 39% off what it costs KGHM to produce a pound of copper, and the company’s own executives said so on an earnings call. KGHM Polska Miedź is a Polish copper company that has never mined an ounce of silver on purpose, and it is the second-largest silver producer in the world. On the company’s first-quarter 2026 results call, Vice President of the Management Board Piotr Krzyżewski explained what the metal had done to the cost of digging copper. C1, in the passage below, is the industry’s measure of what a pound of copper costs after subtracting the revenue from everything else in the same rock; the figures are dollars per pound at KGHM’s Polish operations, and the tax is Poland’s minerals extraction levy, which the transcript discusses separately by name:
“C1 fell from 3.15 to 1.91. However, if we deducted the tax, which accounts for 2.45 of this metric, then our Polish C1 cash cost net of tax would actually be a negative value. This negative cost is naturally driven by high volumes of associated metals and their strong pricing – or, as President Laskowski put it bluntly – by silver.”
Silver, in other words, did the work. Stripping out the Polish tax would take the number below zero on the company’s own arithmetic, and $1.91 a pound is what it actually reported. Across 2024 and 2025, KGHM’s reported silver output moved from 1,340.7 tonnes to 1,347.4 tonnes — an increase of 0.5%. The response to 2025’s record price happened in the treasury, not in the mine plan.
Byproduct Silver Is a Cost Credit, Not a Business
The accounting explains the behaviour. At a copper mine, silver revenue is not booked as a business line — it is subtracted from the cost of producing copper, as a by-product credit. Southern Copper’s 2025 annual report on Form 10-K shows the mechanism working: its operating cash cost per pound of copper, net of credits, fell from $0.89 to $0.58, a change the company attributes “mainly” to a 34-cent increase in by-product revenue credits. Silver was 5.7% of Southern Copper’s revenue across its last three years on the company’s own disclosure, against 75.9% for copper.
Two consequences follow. A higher silver price improves a copper miner’s copper economics rather than justifying an extra ounce of silver, so the incentive it creates points at mining more copper. And an all-in sustaining cost “for silver” at a copper mine is not a meaningful number, because silver there is a deduction from someone else’s cost rather than a cost of its own — which is why every published silver cost figure covers primary miners only.
Byproduct Producers Added Almost No Silver in 2025
Across the byproduct three-quarters of world supply, the record price produced almost nothing, and in several cases produced less. Each figure below comes from the company’s own production report.
| Byproduct producer | What it mines | Silver output change |
|---|---|---|
| KGHM | Copper | +0.5% (2024 to 2025) |
| Glencore | Copper and zinc | +6% in 2025, +2% in H1 2026 |
| Hindustan Zinc | Zinc and lead | −9% (FY2025 to FY2026) |
| South32, Cannington | Lead and zinc | −13%, on a milled grade down 18% |
| Newmont, Peñasquito | Gold, zinc and lead | −15%, on “a significant decrease in silver head grades” — head grade being the metal content of the ore entering the mill |
Where byproduct silver did rise sharply, the cause was someone else’s ore. The World Silver Survey 2026 attributes Peru’s increase to a 56% jump at Antamina “due to higher grades” — higher copper grades, meaning more metal in each tonne of rock, at a copper mine whose plan happened to run through a richer part of the deposit that year. Antamina is a joint venture of BHP, Glencore, Teck and Mitsubishi. Hindustan Zinc’s chief executive Arun Misra put the constraint in a single clause on the company’s July 2026 earnings call: the company achieved “149 tons of silver production in line with the lead production,” while noting that silver “continues to contribute 46% to overall profitability.” Half the profit, and no growth, because lead sets the pace.
Primary Silver Mines Cut Output for a Third Year
If the byproduct three-quarters cannot respond, the burden falls on the quarter that can. It shrank. The World Silver Survey 2026 records that “primary silver supply fell for the third consecutive year, by 1% y/y, following the closure of some mines due to reserve depletion and lower output at numerous, sizable operations.”
The survey’s own country notes name the causes, and none of them is money. Fresnillo’s San Julián fell on the “cessation of the disseminated ore body.” Argentina recorded a fourth consecutive annual decline because its mines are “mostly mature and therefore processing progressively lower grades.” These are the symptoms of ore running out and getting poorer — problems a price cannot solve inside a year, or five.
Fresnillo Cut Output 13.5% and Guides 2026 Lower
The largest primary silver producer in the world has been shrinking through the entire price rally. Fresnillo’s 2025 preliminary results report 48.7 million ounces, down 13.5% from 56.3 million in 2024, and guide 2026 to a range of 42.0 to 46.5 million ounces — lower again. That is attributable production: the company’s own share of output from mines it part-owns, which is why it differs from the 47.6 Moz on the World Silver Survey’s basis in the table above. Its first half of 2026 came in 11.4% below the first half of 2025. Hecla Mining, the largest primary silver producer in the United States, is on the same path: it produced 17.0 million ounces in 2025 and guided 2026 to 15.1–16.5 million.
Guiding production down into 2025’s record market is not a failure of nerve. It is what a company does when its high-grade stopes — the underground blocks of ore actually being mined — are depleting and the replacement ounces are years from being permitted, which is the condition most of the primary sector is in.
First Majestic’s 84% Jump Was a Takeover, Not a Mine
Two primary silver producers did post large increases in 2025, and in both cases the ounces came from a share purchase rather than a shaft. First Majestic Silver’s output rose 84% to 15.4 million ounces, almost entirely because it completed its acquisition of Gatos Silver in January 2025 and consolidated the Los Gatos mine. Coeur Mining rose 57%, having absorbed SilverCrest Metals and its Las Chispas mine. Pan American Silver’s Juanicipio ounces arrived through its September 2025 acquisition of MAG Silver.
Three independent silver producers — Gatos Silver, SilverCrest Metals and MAG Silver — disappeared from the market in a single year, and world supply gained nothing from it. Consolidation moves ounces between columns on a spreadsheet; it does not put metal into the market that was not already being mined.
How Much Does It Cost to Mine an Ounce of Silver?
Silver’s reported cost of production runs from below zero to more than $30 an ounce, depending entirely on who is counting. The World Silver Survey 2026 reports that primary silver miners’ all-in sustaining costs fell for a second consecutive year to $12.21 an ounce, and that “AISC margins widened by 75% y/y, as silver prices climbed, creating significantly greater free cash flow.” Set against a metal averaging $40.03, it reads like an industry printing money and refusing to expand.
A cash cost is what it takes to run the mine day to day. All-in sustaining cost, or AISC, is the industry’s attempt at a full cost of production: cash operating costs, plus the capital needed to keep the mine running, plus royalties and administration, divided by the ounces produced. The $12.21 is an average — a single mean across a group of companies the survey does not name, count or define. Published all-in sustaining costs for the same year run from $11.28 to $31.52 an ounce, and reported cash costs from minus $4.35 to $20.41. Most of both spreads is accounting rather than geology.
| Producer or mine (2025 unless stated) | Cost as the company reports it | What the figure actually is |
|---|---|---|
| Hecla Mining (Alaska, Idaho) | Cash cost −$1.75 · AISC $11.28 | Cash cost net of gold, lead and zinc credits |
| Silvercorp Metals (China) | Cash cost −$0.94 · AISC $14.25 | Net of by-product credits; year to 31 March 2026 |
| Pan American Silver, silver segment | AISC $13.88 | Net of by-product credits |
| Buenaventura (Peru) | Cost applicable to sales $18.71 | Consolidated; explicitly not adjusted for by-product revenue |
| Coeur Mining | Adjusted CAS $17.69 | Co-product basis, costs split by relative revenue |
| Aya Gold & Silver, Zgounder (Morocco) | Cash cost $20.41 | Silver-only mine — nothing to deduct |
| First Majestic Silver | AISC $21.17 | Per silver-equivalent ounce, not per ounce of silver |
| Hecla, Lucky Friday (Idaho) | AISC $21.98 | Net of zinc and lead credits |
| Hochschild, San José (Argentina) | AISC $30.40 | Per silver-equivalent ounce, 83:1 gold ratio |
| Endeavour Silver | AISC $31.52 | Net of by-product credits |
| Fresnillo | Not published | Reports total production costs in dollars, not per ounce |
A Silver-Only Mine Costs $20.41 an Ounce
One mine in the table has no other metal to sell. Aya Gold & Silver describes its Zgounder operation in Morocco as “a rare, silver-only mine, producing silver doré” in its Q4 and full-year 2025 results — doré being the impure bullion a mine pours before it is refined. No gold, no lead, no zinc, and therefore no by-product credit step anywhere in its cost calculation. Zgounder produced 4.83 million ounces in 2025 at a cash cost of $20.41 an ounce, and guides 2026 to roughly $21.50.
Zgounder’s $20.41 is a cash cost, which excludes the sustaining capital, royalties and administration that AISC adds on top. A genuinely silver-only mine therefore spends more on cash costs alone than the industry’s headline all-in figure, and the gap is not a measure of Zgounder being expensive. It is a measure of what the average contains.
Hecla’s Silver Cash Cost Is Below Zero
At the other end of the table sits a company whose silver costs less than nothing to produce. Hecla Mining is the largest primary silver producer in the United States, and its 2025 results report a consolidated silver cash cost, after by-product credits, of minus $1.75 an ounce. Hecla guides 2026 to a range of minus $1.50 to minus $1.25.
A negative figure means the revenue from everything else in the rock exceeded the entire cash cost of running the mines. Hecla’s own definition sets out what is being deducted: “by-product credits include revenues earned from all metals other than the primary metal produced at each unit.” At Greens Creek in Alaska that means gold, lead and zinc; at Lucky Friday in Idaho, zinc and lead. Both are classified as primary silver mines, and both dig ore carrying more value in other metals than in silver.
Hecla’s cash cost is negative; its all-in sustaining cost is $11.28 an ounce, because AISC adds back the capital needed to keep the mines running. Negative cash costs are routine across the polymetallic end of the primary silver sector — Silvercorp reported minus $0.94 an ounce and Endeavour Silver’s Bolañitos minus $4.35 — while a negative all-in cost is rare. Both measures are reported, both are labelled “silver,” and only one of them describes the cost of producing an ounce.
The pattern generalises. The mines reporting the lowest silver costs are the ones with the most other metal in the rock, which means the industry’s cheapest silver is, in accounting terms, by-product silver wearing a different label.
Ten Silver Miners, Five Ways of Counting Cost
None of the figures in the table above is comparable with the others, because the industry has no shared definition. Five ways of counting are in use across the nine companies in the table that publish a per-ounce figure. The largest producer of all publishes none. Hecla, Pan American, Endeavour and Silvercorp report net of by-product credits. Coeur’s 2025 results use a co-product allocation, splitting costs between gold and silver “based on their relative revenue contribution.” First Majestic’s 2025 full-year results and Hochschild’s report per silver-equivalent ounce. Aya’s Zgounder has no other metal to adjust for at all. Buenaventura’s fourth-quarter 2025 results state explicitly that its per-ounce cost is calculated “without adjusting for by-product revenue amounts.” Fresnillo publishes no per-ounce cost at all.
The silver-equivalent method reports a unit that is not an ounce of silver. First Majestic’s 2026 outlook specifies costs “using a fixed gold-to-silver ratio of 75:1” — meaning an ounce of gold is counted as 75 ounces of silver. Move the ratio and the reported cost per ounce moves with it, without anything changing underground. Hochschild’s 2025 preliminary results use 83:1, and publish the same operations in both gold-equivalent and silver-equivalent terms: San José appears as $2,520 per gold-equivalent ounce or $30.40 per silver-equivalent ounce, the same mine described two ways.
None of these companies is breaking a rule, because the rule was written for a different metal. The World Gold Council’s 2018 guidance note on all-in sustaining costs — the standard almost every miner cites — states its objective as metrics reflecting “the full cost of producing and selling an ounce of gold,” and expressly permits by-product and co-product credits to be treated either way provided the method is disclosed. No equivalent silver guidance exists.
Two things are not published. The World Silver Survey states no methodology behind its $12.21 — no statement of whether the figure is struck on a by-product or co-product basis, no sample size, no count of mines, no definition of a primary silver mine. And the three-quarters of world silver that comes out of copper, lead-zinc and gold operations has no published cost of production anywhere, because at those mines silver appears only as a credit against something else. No figure for it exists to dispute.
Escobal Mine: 20 Moz of Silver a Year, Shut Since 2017
Escobal has sat idle for nine years, and money is not what is holding it. Pan American Silver’s mine in south-eastern Guatemala is described by its owner as “one of the largest primary silver deposits globally,” which “produced approximately 20 million ounces of silver annually, with all-in sustaining costs below US$10 per ounce.” Its reserves stand at 264.5 million ounces at a grade of 334 grams per tonne — thirteen years of production at the rate the mine ran before it stopped.
Escobal has not produced an ounce since 2017. Guatemala’s Constitutional Court suspended the mining licence pending a consultation with the Indigenous Xinka people required under International Labour Organization Convention 169, the treaty obliging governments to consult Indigenous communities about projects on their land. Nine years later that consultation is still in its second of three phases.
Record Silver Prices Bought Takeovers, Not New Mines
Money did arrive in the silver industry in 2025. It went almost everywhere except into new production. Announced merger and acquisition activity in silver hit a record $10.8 billion, according to the World Silver Survey 2026 — capital buying ounces that were already being mined, and within $1.6 billion of what the entire non-ferrous mining industry — everything but iron and steel — spent looking for new deposits of every metal there is. Producer hedging — miners selling future output forward — supplied 44.7 million ounces to the market, against zero in each of the four preceding years, meaning the single largest change in the supply column was a financial transaction rather than ore. Exchange-traded products absorbed 278.1 million ounces, lifting global holdings 26% to a record 1.3 billion ounces.
Exploration, the activity that eventually produces new mines, moved the other way. Global non-ferrous exploration budgets fell for a third consecutive year, to $12.4 billion, on the count in S&P Global’s World Exploration Trends. S&P’s public breakdown itemises gold, copper, lithium, nickel and cobalt, and carries no silver line at all.
Mine Lead Times Average 15.7 Years, Silver Included
A decision taken at the top of the market lands years after the price that prompted it. 15.7 years separate a discovery from a working mine, on S&P Global’s count across 127 mines that came online after 2002 — 11.9 years of exploration, drilling and studies, 1.5 years to a construction decision, and 2.3 years of building. The sample is gold, copper, nickel, silver and zinc mines counted together, and no silver-only average is published. The figure comes from a 2023 S&P analysis, reproduced in Mine development times: the US in perspective, the report S&P Global wrote for the National Mining Association in June 2024.
The projects arriving now were sanctioned long before the rally. Endeavour Silver’s Terronera reached commercial production on 1 October 2025; Aya Gold & Silver’s Zgounder expansion in Morocco lifted output from 1.65 to 4.83 million ounces. Both were approved years earlier. The nearest thing to a clean test is Vizsla Silver’s Panuco project in Mexico, funded with over US$450 million in cash and waiting on a single document. Vizsla’s 2025 year-end release says the company will be “ready to build and ready to grow following receipt of our MIA permit” — Mexico’s environmental impact authorisation — with a construction decision in the second half of 2026 “once permits are received,” for first production in the second half of 2027. Fully funded, the binding constraint is still a permit rather than a price. South32’s decision on extending Cannington by open pit is targeted for the first half of its 2028 financial year.
Does Silver Supply Respond to the Price?
The argument above has a serious counter-case in the mine-level data. “One year after a 1% rise in the price of silver, its production is around 1% higher,” reports the Banque de France, adding that “the reaction is particularly strong for silver, copper and nickel.” Vertier, Jacolin, Mien and Léon examined 318 mines across 43 countries between 2000 and 2019 across eight critical minerals, and published in Eco Notepad No. 419 in November 2025.
Silver, on that measurement, is among the most price-responsive of the minerals studied — the opposite of the conclusion the market data suggests. The reconciliation appears in the same paper. Its authors find that for minerals produced as secondary output, “production is more sensitive to changes in primary mineral prices than to changes in the prices of the secondary minerals themselves.”
The two results are harder to reconcile than they look, and what follows does not fully reconcile them. The elasticity is measured one year after a price change, across a sample that already mixes primary and byproduct mines — so the ~1% figure is not a primary-mine number waiting to be scaled down by the 26.1% share, and scaling it would count the same discount twice. Three things can be said. The study’s window closes in 2019, when the primary share was nearer 29% than 26.1%, so it describes a slightly more responsive market than today’s. Its own second finding is that byproduct output tracks the primary metal’s price rather than its own, which is the mechanism this article describes. And 2025’s outturn — a 42% rise in the annual average price against a 3% rise in mine supply — sits well below a near-unit response on any reading of it. Whether that is the structure shifting or one year behaving badly, one year cannot settle.
CPM Group Calls the Silver Deficit a Miscount
A second dissent attacks the deficit itself. Jeffrey Christian of CPM Group, a commodities research house that has published silver market analysis for four decades, argues the annual shortfall conflates investment flows with consumption. Speaking to The Northern Miner in June 2026, in remarks reported by Mining.com, he pointed to the fabrication cycle — “there’s about 800 million oz. of silver used every year that’s fabricated” — moving continuously through refiners and manufacturers, and said that in the price spikes of 1979–80 and 2008–10 “not billions of ounces, but hundreds of millions of ounces came out as scrap and were sold back into the market.”
The size of the above-ground stock is not in dispute; whether it moves is. A study prepared by Precious Metals Insights for the Silver Institute, Price Sensitivity of Above-Ground Silver Stocks, put total above-ground stocks at 19.3 billion ounces at the end of 2023 — about sixteen times a year’s total silver demand, which came to 1,130.6 million ounces in 2025. Its conclusion cuts against Christian rather than with him: “there is no correlation between the overall level of Above-Ground stocks and the silver price,” because “the vast majority of Above-Ground stocks are ‘immobile’.” Metals Focus’ managing director Philip Newman, whose firm compiles the balance, has nonetheless described it as reflecting “shifts within a broad stock pool.”
Christian’s specific charge is answerable out of the survey itself, and the next section does it: the Silver Institute publishes two balances, one that counts fund buying as demand and one that does not, and they differ by a factor of eight. Which figure a reader meets is an editorial accident. Neither dissent touches the mechanism described here, which is not that silver is running out. It is that the flow out of mines does not answer when the price calls.
Three Silver Deficit Figures, Only One of Them Current
The number that carries all of this in public argument is the annual deficit, and searching for its 2026 value returns three different answers, all attributed to the same organisation. Only one is current, and the cause of the confusion changes what the word “deficit” means.
| Figure in circulation | Where it actually comes from | Status |
|---|---|---|
| 46.3 Moz | World Silver Survey 2026 and the Silver Institute’s release of 15 April 2026 | Current and correct |
| 67 Moz | The Silver Institute’s interim forecast of 10 February 2026 | Genuine, but superseded two months later |
| 215 Moz “largest on record” | Attributed to the World Silver Survey 2026 by a trade newsletter | Appears in no Silver Institute document |
The Silver Institute’s release of 15 April 2026 states the position directly: “with mine production stable this year, we expect the structural market deficit to widen to 46.3 Moz.” UBS separately cut its own estimate to 60–70 million ounces in May 2026, from an earlier 300 million.
The inflation comes from a second line in the same table. The survey publishes two balances. The headline market balance for 2025 was −40.3 million ounces, which treats an investor buying a fund share as investment rather than as consumption. The second line, which the survey labels the market balance less exchange-traded products, deducts the 278.1 million ounces those funds absorbed and comes to −318.4 million ounces. Which figure a reader meets depends entirely on which line a publication copied, and the second is roughly eight times the first. Neither of them is 215.
Silver’s Deficit Peaked in 2022, Widens Again in 2026
On the survey’s own series the shortfall peaked in 2022 and narrowed in each of the three years after it, to −40.3 Moz in 2025. The 2026 forecast breaks the run: −46.3 Moz, a wider gap than the year before, and the Silver Institute’s own wording is that the deficit will “widen.”
| Year | Market balance (Moz) | Direction |
|---|---|---|
| 2021 | −83.7 | First deficit year |
| 2022 | −254.0 | Peak |
| 2023 | −200.1 | Narrowing |
| 2024 | −137.9 | Narrowing |
| 2025 | −40.3 | Narrowing |
| 2026 forecast | −46.3 | Sixth consecutive shortfall, and the first to widen since 2022 |
Cumulatively, the five deficit years from 2021 to 2025 drew 716 million ounces out of above-ground stocks — roughly ten months of world mine production. The narrowing through 2025 came from the demand side rather than the supply side: photovoltaic silver demand fell 6% in 2025 and is forecast to fall a further 19% in 2026 as manufacturers thin their silver loadings, a shift traced in detail in our companion article on silver in solar panels.
Is There a Silver Shortage?
A deficit measures the gap between a year’s supply and demand; a shortage means the metal cannot be had. October 2025 showed how far apart those are. The World Silver Survey 2026 records that around 225 million ounces were added to CME vaults in New York between December 2024 and early October 2025 while London stocks fell, as traders positioned for possible US tariffs on imported metal. London’s lending market seized: one-month lease rates — the annualised cost of borrowing metal rather than buying it — hit an all-time peak of 34.9% on 9 October 2025 on Bloomberg’s figures, and were back to 5.6% eighteen days later.
The reason the squeeze bit so hard is the free float — the portion of vaulted metal not already owned by someone. Metals Focus’ analysis of exchange-traded product and LBMA data, published in the same survey, found that by the end of September 2025 physically-backed investment products accounted for 83% of London’s inventories, leaving a free float of about 136 million ounces. For scale, India imported 232 million ounces of silver over 2025, roughly 129 million of it in the final four months — a four-month buying run close to the entire quantity of London metal available to buy.
A Zinc Bear Market Would Cut Silver Supply
For 2026 the Silver Institute forecasts mine production of 844.1 million ounces, down 0.3% — growth in Mexico offset by declines elsewhere — with primary silver output expected to keep falling and the deficit widening to 46.3 million ounces. Recycling is forecast to rise 7% to 211.3 million ounces, its highest since 2012 — the one part of supply that does answer to the silver price, and the part of Jeffrey Christian’s argument the data supports.
What could actually change the supply picture has little to do with the silver price. It is a Guatemalan court’s decision on Escobal, Vizsla’s first pour at Panuco in 2027, and — the risk that follows directly from the byproduct structure — the zinc and lead prices that decide whether the mines supplying 29.4% of the world’s silver stay open. The Silver Institute flagged this in its forecast release of 10 February 2026: weak base-metal prices threaten the viability of the lead-zinc operations that produce the largest single slice of world silver. A silver bull market running alongside a zinc bear market would be a net negative for silver supply.
One policy change is already on the books. On 7 November 2025 the United States added silver to its Final List of Critical Minerals, published in the Federal Register — a designation it did not carry in 2022, and one that follows from exactly the supply concentration and byproduct dependence described above. What that means in practice is set out in our guide to what critical minerals are.
How Investors Hold Silver
No listed vehicle gives direct exposure to primary silver supply. The physically-backed funds hold bullion, which tracks the price and leaves mine output untouched. The equity funds hold companies, and the largest position in the biggest of them operates no mines at all. The byproduct structure runs through the investment side as well, and it is the reason the market is organised the way it is. What follows describes the vehicles as factual landscape — what each one is, what it holds, what it charges and how it is taxed — not as a comparison or a recommendation.
Silver ETFs Hold Metal, Not a Claim on Metal
Physically-backed funds hold allocated bullion — specific numbered bars, set aside for the fund — on investors’ behalf, which is why their holdings show up directly in the free-float arithmetic above. The iShares Silver Trust alone held 487.8 million ounces on 7 August 2026, against 894.4 million ounces in all London vaults at the end of 2025 — one fund holding the equivalent of more than half the London stock, and roughly 58% of a full year of world mine production.
| Product | Ticker / exchange | Fee | Silver held | Legal structure |
|---|---|---|---|---|
| iShares Silver Trust | SLV — NYSE Arca | 0.50% | 487.8 Moz ($31.4bn), 7 Aug 2026 | US grantor trust |
| Sprott Physical Silver Trust | PSLV — NYSE Arca & TSX | 0.51% MER | 215.4 Moz ($13.7bn), 7 Aug 2026 | Ontario closed-end trust; monthly physical redemption |
| abrdn Physical Silver Shares | SIVR — NYSE Arca | 0.45%, waived to 0.30% to 28 Feb 2027 | 67.2 Moz at 30 Jun 2026; $4.3bn at 7 Aug | US grantor trust |
| iShares Physical Silver ETC | SSLN / ISLN — London | 0.20% TER | 48.9 Moz ($3.1bn), 7 Aug 2026 | Secured debt security, not a fund |
| WisdomTree Physical Silver | PHAG — London, Xetra, Tokyo | 0.49% MER | $2.9bn, 7 Aug 2026 | Exchange-traded commodity (Jersey issuer) |
MER and TER, in the table above, are the Canadian and European terms for a fund’s total annual charge — management expense ratio and total expense ratio. Behind what looks like one product category sit three different legal animals, and they are taxed differently. A US grantor trust such as SLV or abrdn’s SIVR gives holders direct pro-rata ownership of the metal. A Canadian closed-end trust such as PSLV carries a right of physical redemption and, for a US holder, is a passive foreign investment company — a US tax classification that treats a foreign fund’s gains punitively unless the holder elects otherwise. A European ETC such as SSLN is not a fund at all — iShares’ own documentation describes the securities as “limited recourse obligations… payable solely out of the underlying secured property,” which is to say a secured debt of a special-purpose company.
Silver Miner Funds Hold Streamers and Copper Companies
Funds holding mining equities rather than metal inherit the byproduct problem in their own portfolios, and the holdings lists show it plainly. The Amplify Junior Silver Miners ETF held KGHM — a copper company — at 4.93% on 10 August 2026, with the zinc and copper producer Boliden at 4.73%. The Global X Silver Miners ETF had Wheaton Precious Metals, a streaming company that operates no mines at all, as its largest position at 22.96%. Weightings move; the ranks in particular date faster than the percentages.
| Fund | Ticker / exchange | Fee | Size | Largest holdings |
|---|---|---|---|---|
| Global X Silver Miners | SIL — NYSE Arca | 0.65% | $4.74bn, 39 holdings | Wheaton 22.96%, Pan American 12.43%, Coeur 10.30% |
| Amplify Junior Silver Miners | SILJ — NYSE Arca | 0.69% | $3.86bn, 67 holdings | Hecla 9.31%, First Majestic 9.29%, KGHM 4.93% |
| iShares MSCI Global Silver and Metals Miners | SLVP — Cboe BZX | 0.39% | $941m, 35 holdings | Not published on the fund page |
| Sprott Silver Miners & Physical Silver | SLVR — Nasdaq | 0.65% | $740m, 77 holdings | First Majestic 20.44%, PSLV 16.12%, Aya 8.77% |
All figures are as reported by each issuer on 7 August 2026, except SILJ’s holdings, dated 10 August. Fund compositions change; the numbers above are a snapshot rather than a standing description.
Streaming Exists Because Byproduct Silver Is Cheap
An entire industry exists because byproduct silver is cheap to buy from the people who dig it. A streaming company pays a mine owner a large sum up front for the right to buy a fixed share of its future metal at a price agreed in advance — either a fixed number of dollars an ounce, or a percentage of the spot price. Wheaton’s fixed prices below run between $4.62 and $6.32 an ounce, against a metal trading near $67 in August 2026. Wheaton Precious Metals’ 2026 Annual Information Form describes the model as acquiring metal production “for an initial upfront payment plus an additional cash payment for each ounce or pound delivered which is fixed by contract, generally at or below the prevailing market price.”
Reading Wheaton’s silver streams shows who sells them. Every significant one is attached to a base-metal or gold mine: Newmont’s Peñasquito, the BHP–Glencore–Teck–Mitsubishi joint venture at Antamina, Hudbay’s Constancia, Boliden’s Zinkgruvan and Neves-Corvo, Capstone’s Cozamin. These are exactly the operators for whom silver is a cost credit rather than a business — and each of them chose to convert that credit into cash up front rather than manage it.
| Wheaton silver stream | Mine owner & main metal | Wheaton’s share | Price it pays per ounce |
|---|---|---|---|
| Peñasquito, Mexico | Newmont — gold, zinc, lead | 25% | $4.62 fixed |
| Antamina, Peru | BHP, Glencore, Teck and Mitsubishi — copper, zinc | 33.75% | 20% of spot |
| Constancia, Peru | Hudbay — copper | 100% | $6.32 fixed |
| Zinkgruvan, Sweden | Boliden — zinc | 100% | $4.81 fixed |
| Cozamin, Mexico | Capstone — copper | 50% | 10% of spot |
Wheaton reported silver at 52% of revenue in the second quarter of 2026, the first quarter in which silver outweighed gold in its accounts, against 36% for the whole of 2025.
The US Taxes Physical Silver as a Collectible
American investors face a tax treatment for silver that differs from ordinary shares, and the chain of statute behind it is short. The Internal Revenue Code defines a collectible at section 408(m)(2) to include “any metal or gem.” Section 1(h)(5)(A) then applies the collectibles rate to gains on anything in that definition, expressly disregarding the bullion carve-out that follows it. The result, as the IRS states in Topic no. 409, is that “net capital gains from selling collectibles (such as coins or art) are taxed at a maximum 28% rate,” against 0%, 15% or 20% for ordinary long-term gains.
The treatment reaches physically-backed funds too. The iShares Silver Trust’s 2025 annual report on Form 10-K states that “gains recognized by individuals from the sale of collectibles, including silver, held for more than one year are taxed at a maximum rate of 28%,” the trust being treated as a grantor trust whose holders own the metal directly. Sprott’s own fund documentation describes a different route: gains on PSLV units “can be taxed at a capital gains rate of 15%/20% versus the 28% collectibles rate” for US non-corporate investors who file a timely Qualified Electing Fund election — the annual filing that swaps that punitive treatment for ordinary capital-gains rates — because the Canadian trust is a passive foreign investment company rather than a grantor trust. Shares in mining companies are securities rather than metal, so the collectibles rate does not reach them at all.
Outside the United States the rules diverge sharply, and the differences are structural rather than cosmetic. Canada’s Income Tax Regulations section 4900 permit a registered retirement savings plan or tax-free savings account to hold physical silver directly, provided it is a Royal Canadian Mint legal-tender coin or a bar of at least 999 fineness produced by a refiner on the London Bullion Market Association’s good delivery list. The United Kingdom goes the other way: HMRC’s Pensions Tax Manual specifies investment-grade gold bullion as permissible in a self-invested personal pension and names no other metal, so silver reaches a self-invested personal pension or an individual savings account through listed securities rather than as metal. Britain also charges VAT on investment silver, because the VAT exemption is written for gold alone. Tax rules change and vary by circumstance; these are descriptions of the current position rather than advice about it.
Storing Silver Costs 1.9% a Year Against 1.0% for Gold
Holding the metal itself carries costs that do not appear in the silver price. The Perth Mint, owned by the government of Western Australia, charges 1.9% a year to store allocated silver against 1.0% for gold — nearly double, because storage is priced on bulk and an ounce of silver at $67 occupies far more vault space per dollar than an ounce of gold. Compounded over a decade, a 1.9% annual charge consumes roughly a sixth of the position.
Vaulted metal is either allocated or unallocated, and the two are different things. The London Bullion Market Association defines an allocated account as one “backed by a specific bar of the precious metal.” The holder gets “a weight list of bars… showing the unique bar, plate or ingot number, gross weight, the assay or fineness of each,” and “does not have a credit exposure to the institution where the account is maintained” — if the vault operator fails, the bars are still the holder’s. An unallocated account, by contrast, “reflects a debit or credit over an account, and the account holder has a contractual claim against the clearer – rather than a specific bar.”
Coins carry a further markup over the metal price. The United States Mint sells silver American Eagles to its authorised purchasers at “the LBMA Silver Price plus a $3.05 per coin premium” — a fixed dollar amount, unlike gold Eagles which carry a percentage. Because it is fixed, silver’s premium falls as a share of the price when silver rises: $3.05 is 4.6% of a $67 ounce and was 10% of a $30 ounce. That is the wholesale floor before any dealer’s own margin, and no independent body publishes typical retail premiums above it.
None of the above is a recommendation; it describes how the silver market is structured, and any decision belongs with you and a licensed professional.